Connect to the Target With HANtune
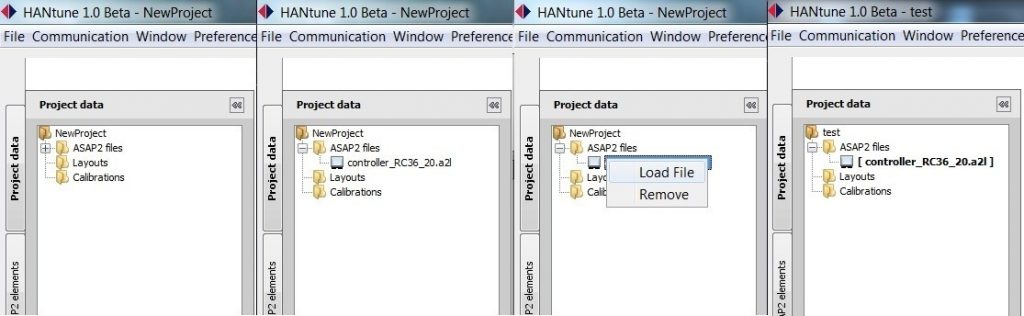
MATLAB generates an ASAP2(.a2l) file which contains the necessary information for HANtune to connect to the controller. The ASAP2 file can be loaded into HANtune by right clicking ‘ASAP2 files’ and choosing ‘Add ASAP2 file’ after it has been opened you have to load it by right clicking on the .a2l file en press ‘Load File’. The .a2l file is located in the same directory as the model.
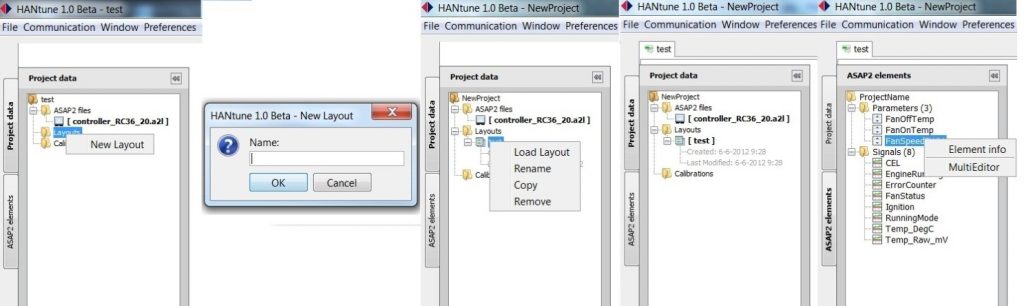
Before you can see any data, you need to create a new layout. This can be done by right clicking the layout map, and then selecting “New Layout”. After you give the layout a name you can open it by right clicking on it and selecting ‘Load File’.
In the layout you can change or show a value by right clicking on the variable in the ASAP2 list and selecting an editor for a parameter, or a viewer for a signal.
The maximum number of signals depends on the model running time of the model and HANtune. On a high frequency (1 kHz) you can only use a few signals without overloading the bus. The lower the frequency, the more signals you can properly use. Always check the busload and lag indictor, shown in Figure 6‑8 – HANtune Communication status, to know if you are using too many signals or not.
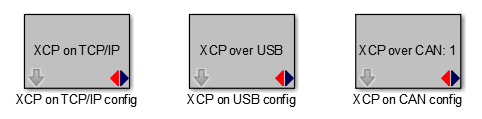
There are different ways to connect to the Olimexino, using either the CANbus or USB. In order to use one of these communication options it has to be enabled in the model with the appropriate config block:
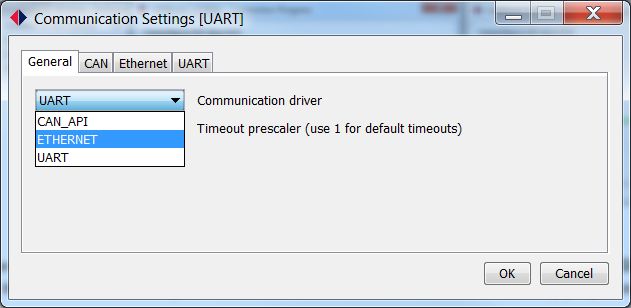
To select the protocol in HANtune go to the ‘communication settings’ located in the communication menu. In the tab ‘general’ the protocol can be chosen. In the other tabs the settings for each protocol can be adapted.
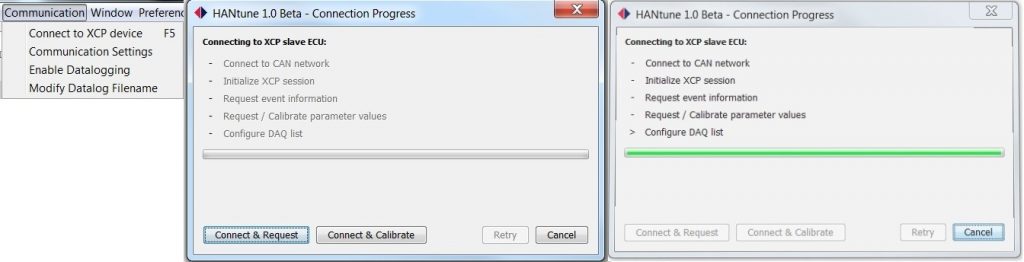
Press ‘connect to XCP device’ in the communication menu or press ‘F5’ to connect. Before HANtune sets up a connection to the controller you need to define if you want to ‘Connect & Request’ or ‘Connect & Calibrate’. If you choose the ‘Connect & Request’ the parameters of the controller will be shown at your screen. By pressing ‘Connect & Calibrate’ the parameters that have been set in HANtune will be send to the controller when connecting.
The status bar on the bottom of the screen gives information to the user about the connection. It shows to which controller HANtune is connected, the amount of Parameters and Signals, the maximum frequency, a prescaler to change the frequency, the calculated real frequency, and a bar to enable data logging. The real frequency is the frequency used by HANtune to refresh the signals. At the right side of the status bar there is an indicator that turns clockwise to show if there are signals transmitted. This indicator will color red if there is data loss. The bars left from the log file bar are a lag indicator showing how much of the received data is actually shown on the screen. Although you do not see some of that data, it is still logged in the log file. The DAQ list bar shows the estimated busload by the number of signals and the used prescaler.
![]()