Difference between revisions of "HANtune/Table Editor"
(→Working Point) |
(→Working Point) |
||
| Line 33: | Line 33: | ||
==Working Point== | ==Working Point== | ||
| − | You can use a visual marker to show where you are currently at in the table. This is called a "Working Point" and can activated be checking the "show" checkbox in the settings dialog | + | You can use a visual marker to show where you are currently at in the table. This is called a "Working Point" and can activated be checking the "show" checkbox in the settings dialog. |
[[File:TABLE_WORKING_POINT.PNG|No cell color interpolation]] | [[File:TABLE_WORKING_POINT.PNG|No cell color interpolation]] | ||
Revision as of 11:24, 15 October 2019
The Table Editor is a HANtune window that can be used to edit tables found in your ASAP2 file. Currently it supports one- or two-dimensional tables as defined by the XCP protocol. It has the option to color your table cells based on their value (e.g. RGB or HSB). Additionally a working point can be shown to indicate where you're currently at in the table.
Contents
Cell Color Interpolation
The cell color interpolation setting allows you to choose what kind of coloring should be used for your table; None, RGB or HSB.
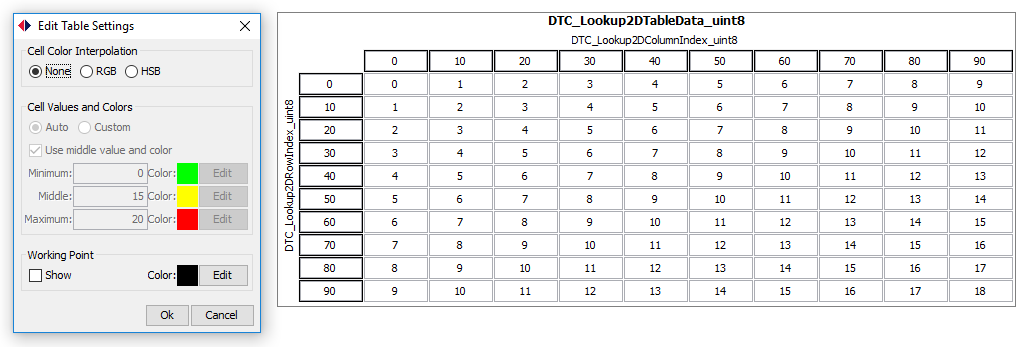
None
When no cell color interpolation is used all cells will be white and a table will look as following:
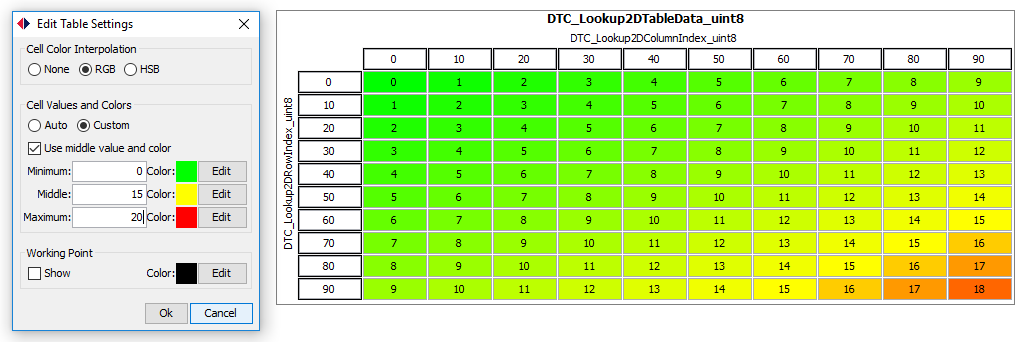
RGB
When RGB cell color interpolation is used (using colors from green to red) a table will look as following:
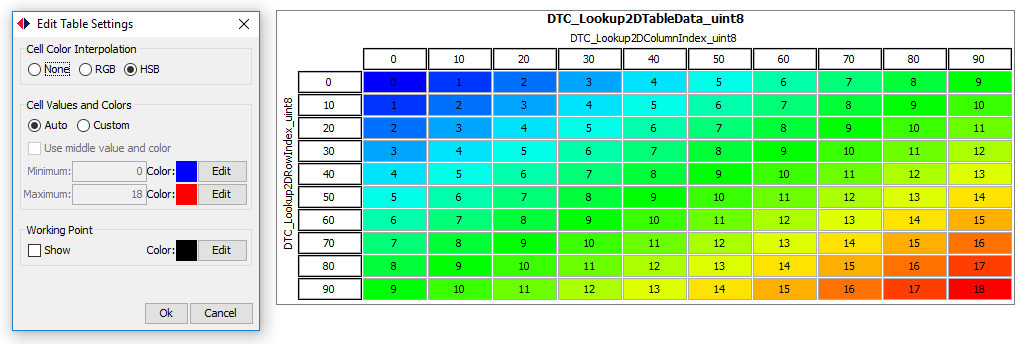
HSB
When HSB cell color interpolation is used (using colors from blue to red) a table will look as following:
Cell Values and Colors
You can choose what color should be shown for what value, for all cell values in between colors will be interpolated based on the cell color interpolation settings.
Mid Color
To color the cells at least two colors must be chosen, a color for the lower and a color for the upper value. A third middle color is optional. When a middle color is used (using colors green, yellow and red) a table will look as following:
Custom
By default the table will color its cells based on the lowest and highest value in your table. If you want to define the range yourself you can use the "custom" setting. When "Custom" is used (using colors from green, yellow and red and values 0, 10 and 20) a table will look as following:
Working Point
You can use a visual marker to show where you are currently at in the table. This is called a "Working Point" and can activated be checking the "show" checkbox in the settings dialog.


